
所属成套资源:牛津译林版必修第三册英语名师精品课件(全套)
牛津译林版英语必修第三册U3 Chart description(图表描述)课件
展开
这是一份2022年牛津译林版英语必修第三册U3 Chart description(图表描述)课件,共12页。
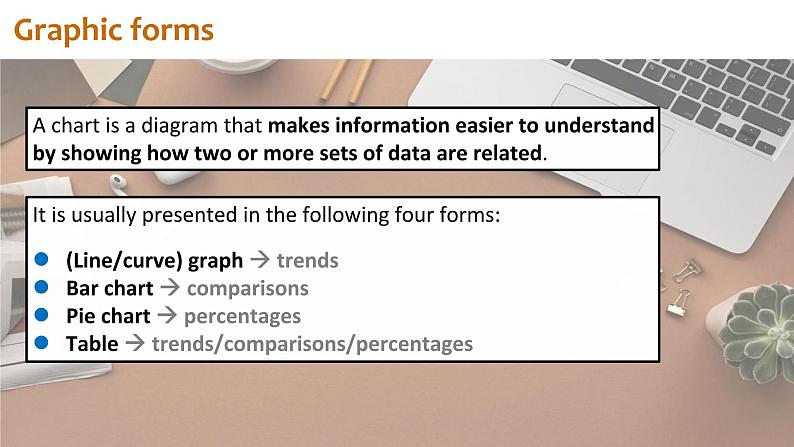
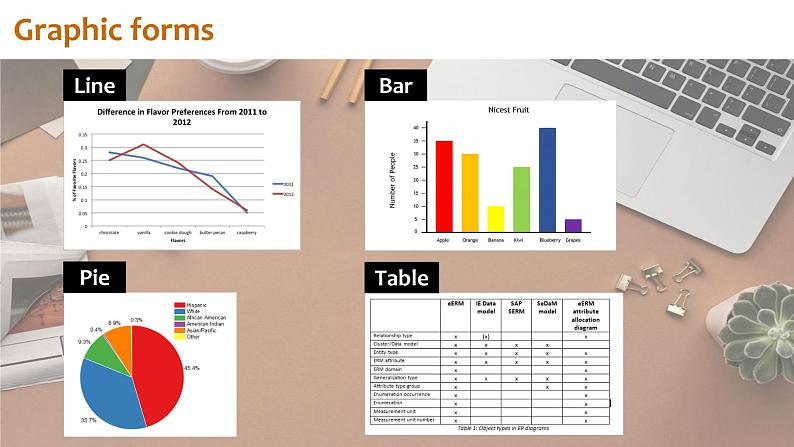
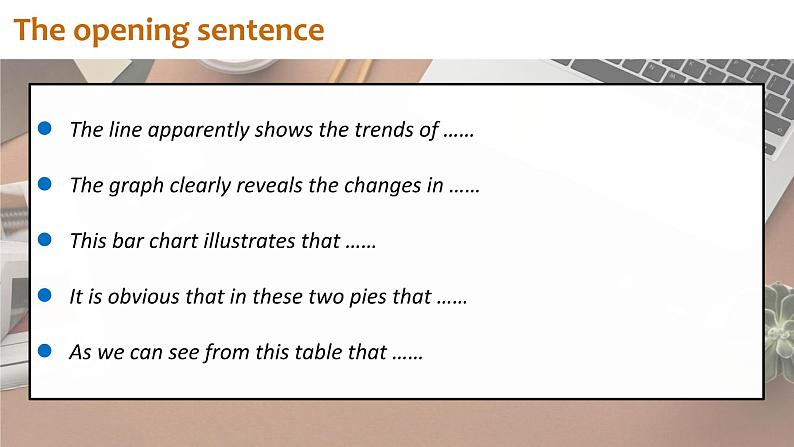
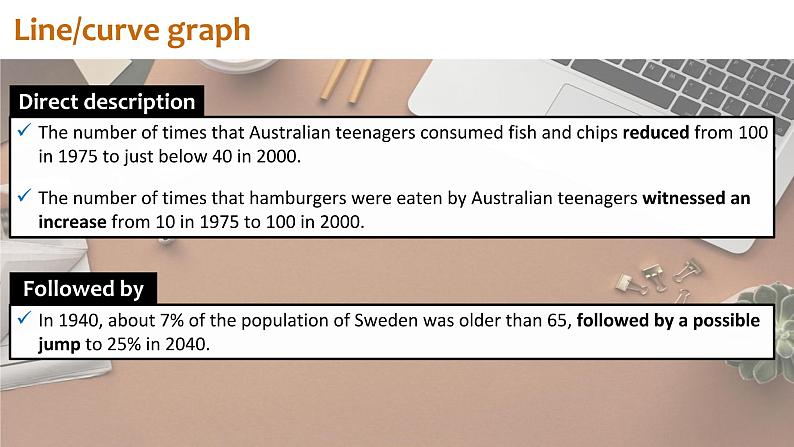
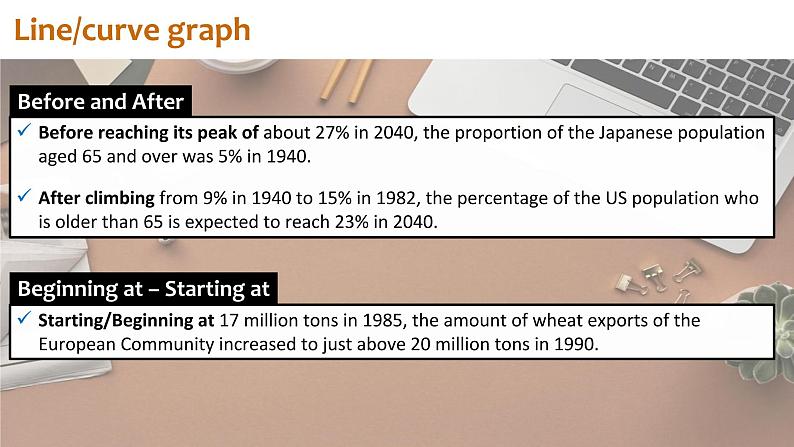
Chart description基于新高考的能力提升A chart is a diagram that makes information easier to understand by showing how two or more sets of data are related. Graphic forms It is usually presented in the following four forms:(Line/curve) graph trends Bar chart comparisons Pie chart percentages Table trends/comparisons/percentages Graphic forms LineBarPieTable The opening sentenceThe line apparently shows the trends of ……The graph clearly reveals the changes in ……This bar chart illustrates that ……It is obvious that in these two pies that ……As we can see from this table that …… Line/curve graph The number of times that Australian teenagers consumed fish and chips reduced from 100 in 1975 to just below 40 in 2000.The number of times that hamburgers were eaten by Australian teenagers witnessed an increase from 10 in 1975 to 100 in 2000.Direct descriptionFollowed byIn 1940, about 7% of the population of Sweden was older than 65, followed by a possible jump to 25% in 2040. Line/curve graph Before reaching its peak of about 27% in 2040, the proportion of the Japanese population aged 65 and over was 5% in 1940.After climbing from 9% in 1940 to 15% in 1982, the percentage of the US population who is older than 65 is expected to reach 23% in 2040.Before and AfterBeginning at – Starting atStarting/Beginning at 17 million tons in 1985, the amount of wheat exports of the European Community increased to just above 20 million tons in 1990. Bar chartThe percentage of British tourists who chose hotel (about 55%) as their choice of accommodation in 2010 was 5 times greater/more than the figure for camping (11%).Greater than – More thanThe greatest – The biggestOf the 4 choices of accommodation among British tourists in 2010, hotel was the most popular option for people in all 4 parts of Britain – England (55%), Scotland (52%), Wales (49%) and Northern Ireland (45%).Trend comparisonFrom 2006 to 2010, the sales of romance books in city A recorded a slight increase from about $82 thousand to $84 thousand, whereas the opposite trend was true of sales of the other 4 fiction book types. Pie chartBicycles account for 40% of the vehicle population in town A.accounts for …% of ……% of … did something30% of students in this school had to re-sit a final exam at least once.is the dominant … in … with a … of …Company A is the dominant player in the textile industry with a market share of 65%. Pie chartThe proportion of social media users (95%) is the third largest among people aged 20 to 35.The proportion of … (…%) is the second/third/fourth largest in/among …The percentage of … (…%) surpasses … (…%) but is left behind by … (…%)The percentage of tablet users (67%) surpasses laptop users (64%) but is left behind by that of mobile phone users (70%).The percentage of … (…%) is … times larger/smaller than … (…%)The percentage of male CEOs (80%) is 4 times larger than female CEOs (20%) in this industry. The ending sentenceOverall, ……In conclusion, ……In short, ……In summary, ……To sum up / wrap up, ……After-class activityWriting: Ways people go traveling by percentage.Thank you!